Activity
The Activity view provides real-time visibility into hot keys and command logs across your cluster. It has two tabs: Hot Keys and Command Logs.
Hot Keys Monitoring
Section titled “Hot Keys Monitoring”Track the most frequently accessed keys in your cluster.
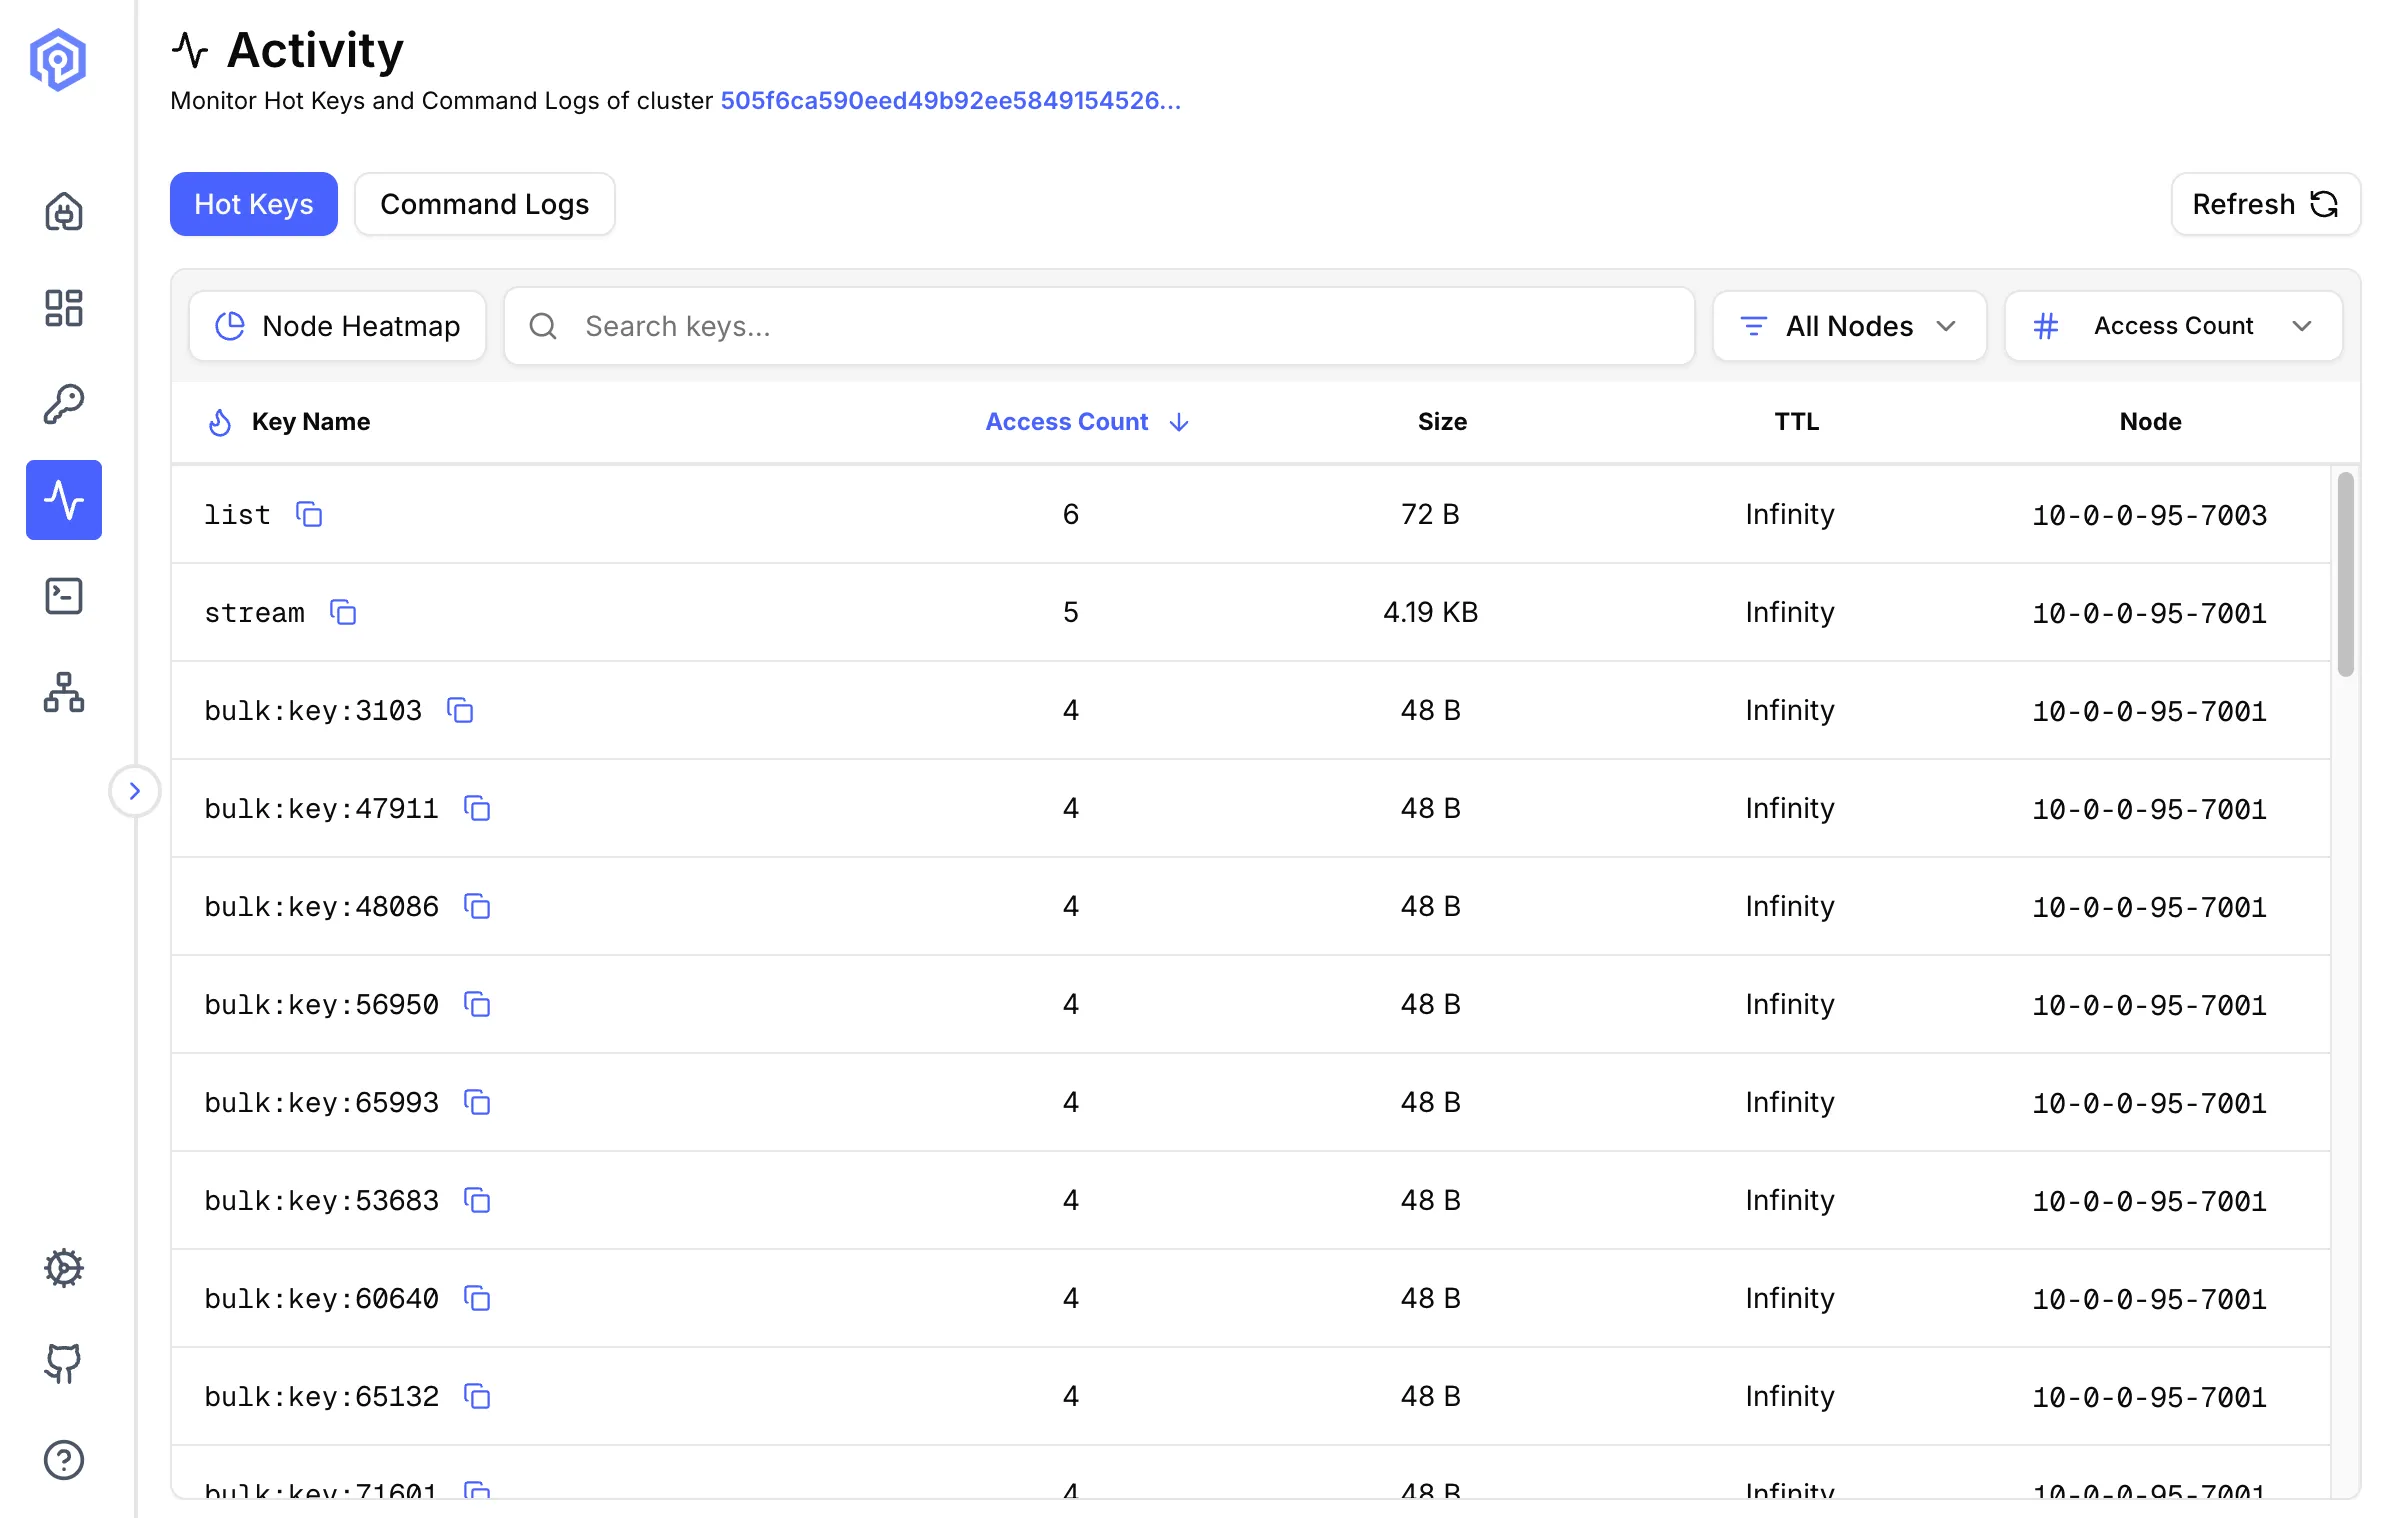
What are Hot Keys?
Section titled “What are Hot Keys?”Hot keys are keys that receive disproportionately high traffic, potentially causing:
- Performance bottlenecks
- Uneven load distribution
- Memory pressure on specific nodes
Valkey Admin supports two detection methods: Hot Slots (recommended) and Monitor-based detection.
Hot Slots Detection (Recommended)
Section titled “Hot Slots Detection (Recommended)”Uses the CLUSTER SLOT-STATS command to identify hot slots by CPU usage, network ingress, and network egress. This is the preferred method as it has no performance impact on your cluster.
Requirements:
- Valkey 8.0+ (
CLUSTER SLOT-STATSwas introduced in Valkey 8.0) cluster-slot-stats-enabledset toyes- LFU eviction policy (
allkeys-lfuorvolatile-lfu) configured on the cluster - Cluster mode (not available for standalone instances)
When all conditions are met, Valkey Admin queries each shard’s slot statistics, identifies the hottest slots by cpu-usec, and resolves the keys within those slots.
Monitor-based Detection
Section titled “Monitor-based Detection”Uses the Valkey MONITOR command to capture all commands in real time, then aggregates key access frequency from the command stream. Works with any Valkey or Redis version, in both standalone and cluster modes.
When you start monitoring, four settings control the sampling behavior:
- Duration: How long each sampling run captures commands (default: 10 seconds).
- Interval: How long to wait between sampling runs (default: 10 seconds).
- Max Commands Per Run: Maximum commands captured per cycle (default: 1,000,000). Lower values reduce memory usage on busy clusters.
- Cutoff Frequency: Minimum access count for a key to be considered hot (default: 100). Lower values show more keys; higher values surface only the most active keys.
This creates a repeating cycle: capture for duration, pause for interval, capture again. The hot keys displayed are from the most recent sampling run.
Cluster behavior:
- Web/Docker mode: Monitoring starts on all primary nodes simultaneously.
- Desktop (Electron) mode: Monitoring only starts on nodes you have explicitly connected to.
In both modes, hot keys are aggregated across all monitored nodes and sorted by access count.
When hot slots requirements are not met, Valkey Admin prompts you to start monitoring to calculate hot keys.
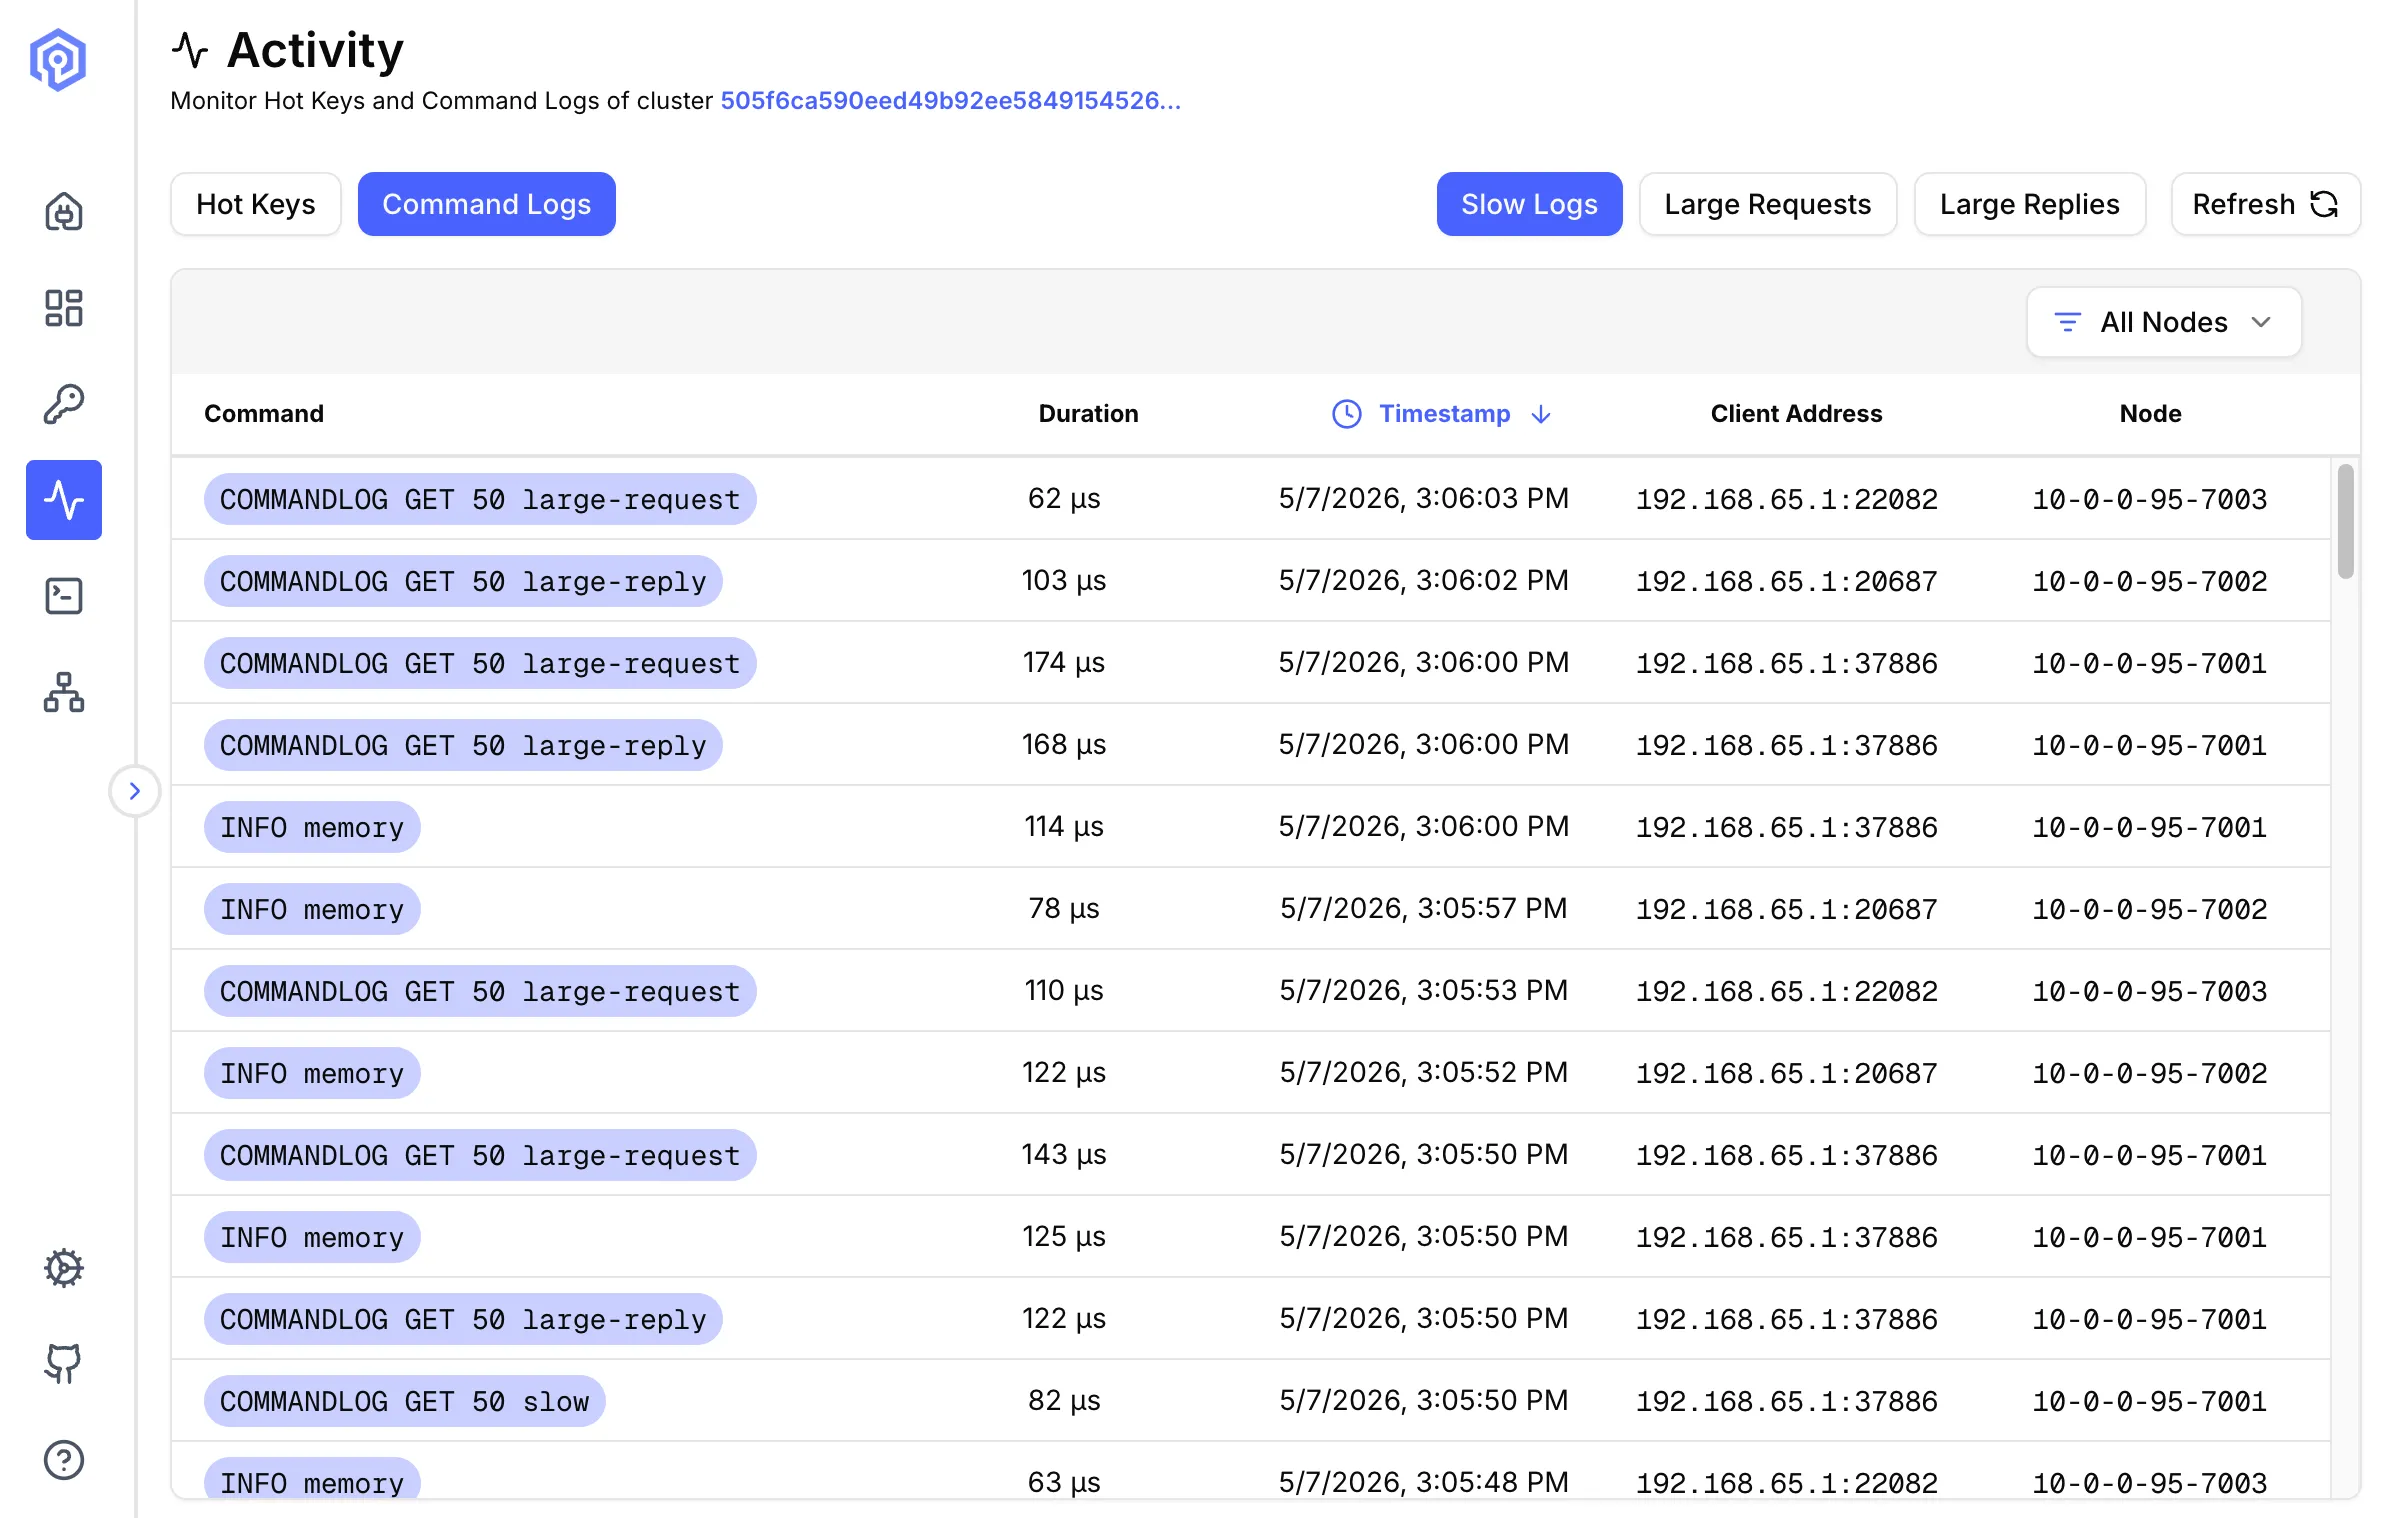
Slow Logs
Section titled “Slow Logs”Monitor commands that take longer than expected to execute.
What are Slow Logs?
Section titled “What are Slow Logs?”Slow logs record commands exceeding a configured execution time threshold, helping identify:
- Inefficient commands
- Large data operations
- Potential optimization targets
Configuration
Section titled “Configuration”Set slow log threshold:
# Log commands taking longer than 10msCONFIG SET slowlog-log-slower-than 10000Viewing Slow Logs
Section titled “Viewing Slow Logs”Each entry shows:
- Timestamp: When command was executed
- Duration: Execution time (microseconds)
- Command: Full command text
- Arguments: Command arguments (abbreviated if large)
- Client Address: Source of the command
Analysis
Section titled “Analysis”Use slow logs to:
- Identify Bottlenecks: Find consistently slow operations
- Optimize Queries: Refactor inefficient commands
- Capacity Planning: Understand load patterns
- Debug Issues: Track down performance problems
Common Slow Commands
Section titled “Common Slow Commands”KEYS *: Scans entire keyspace (use SCAN instead)- Large
HGETALL: Fetching huge hashes SORT: Without LIMIT on large setsSMEMBERS: On large sets
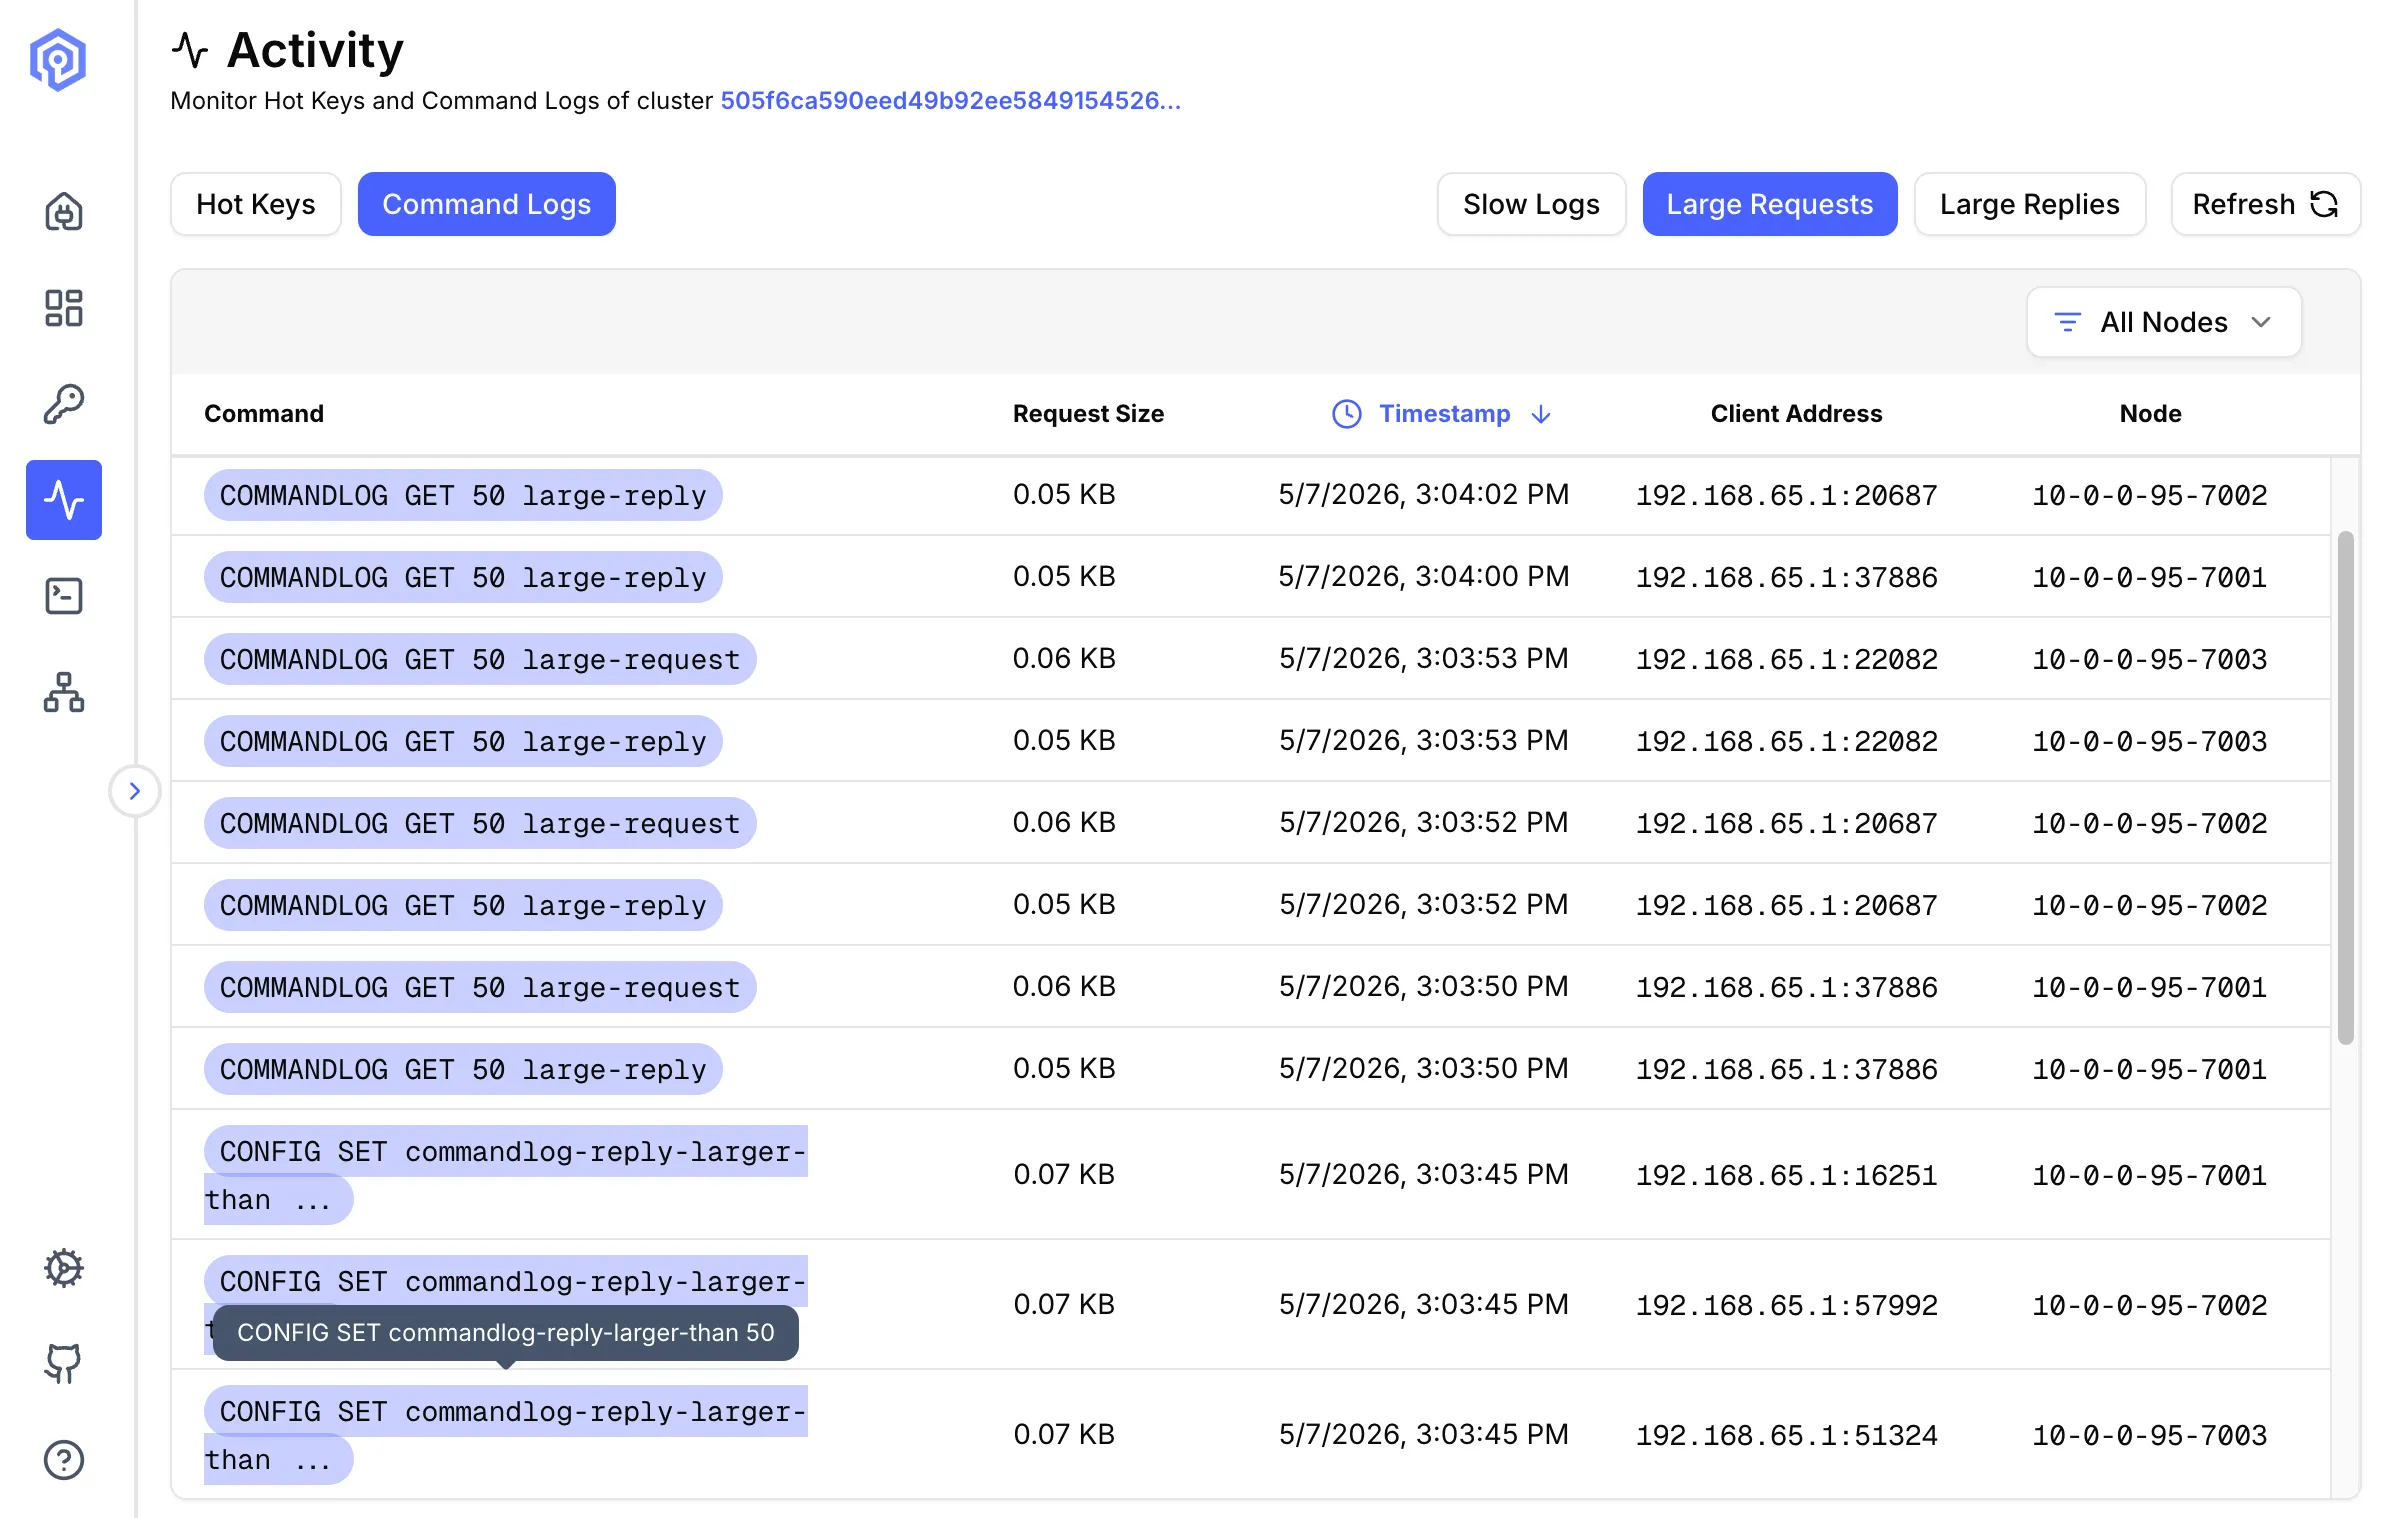
Large Requests
Section titled “Large Requests”Track commands with large input payloads.
Why Monitor Large Requests?
Section titled “Why Monitor Large Requests?”Large requests can:
- Saturate network bandwidth
- Increase memory usage
- Block other operations
- Slow down replication
Metrics Tracked
Section titled “Metrics Tracked”- Request Size: Payload size in bytes
- Command: Operation type
- Key: Target key
- Timestamp: When received
- Client: Source address
Setting Thresholds
Section titled “Setting Thresholds”Configure what constitutes a “large” request:
# Alert on requests larger than 1MBCONFIG SET commandlog-request-larger-than 1000Large Replies
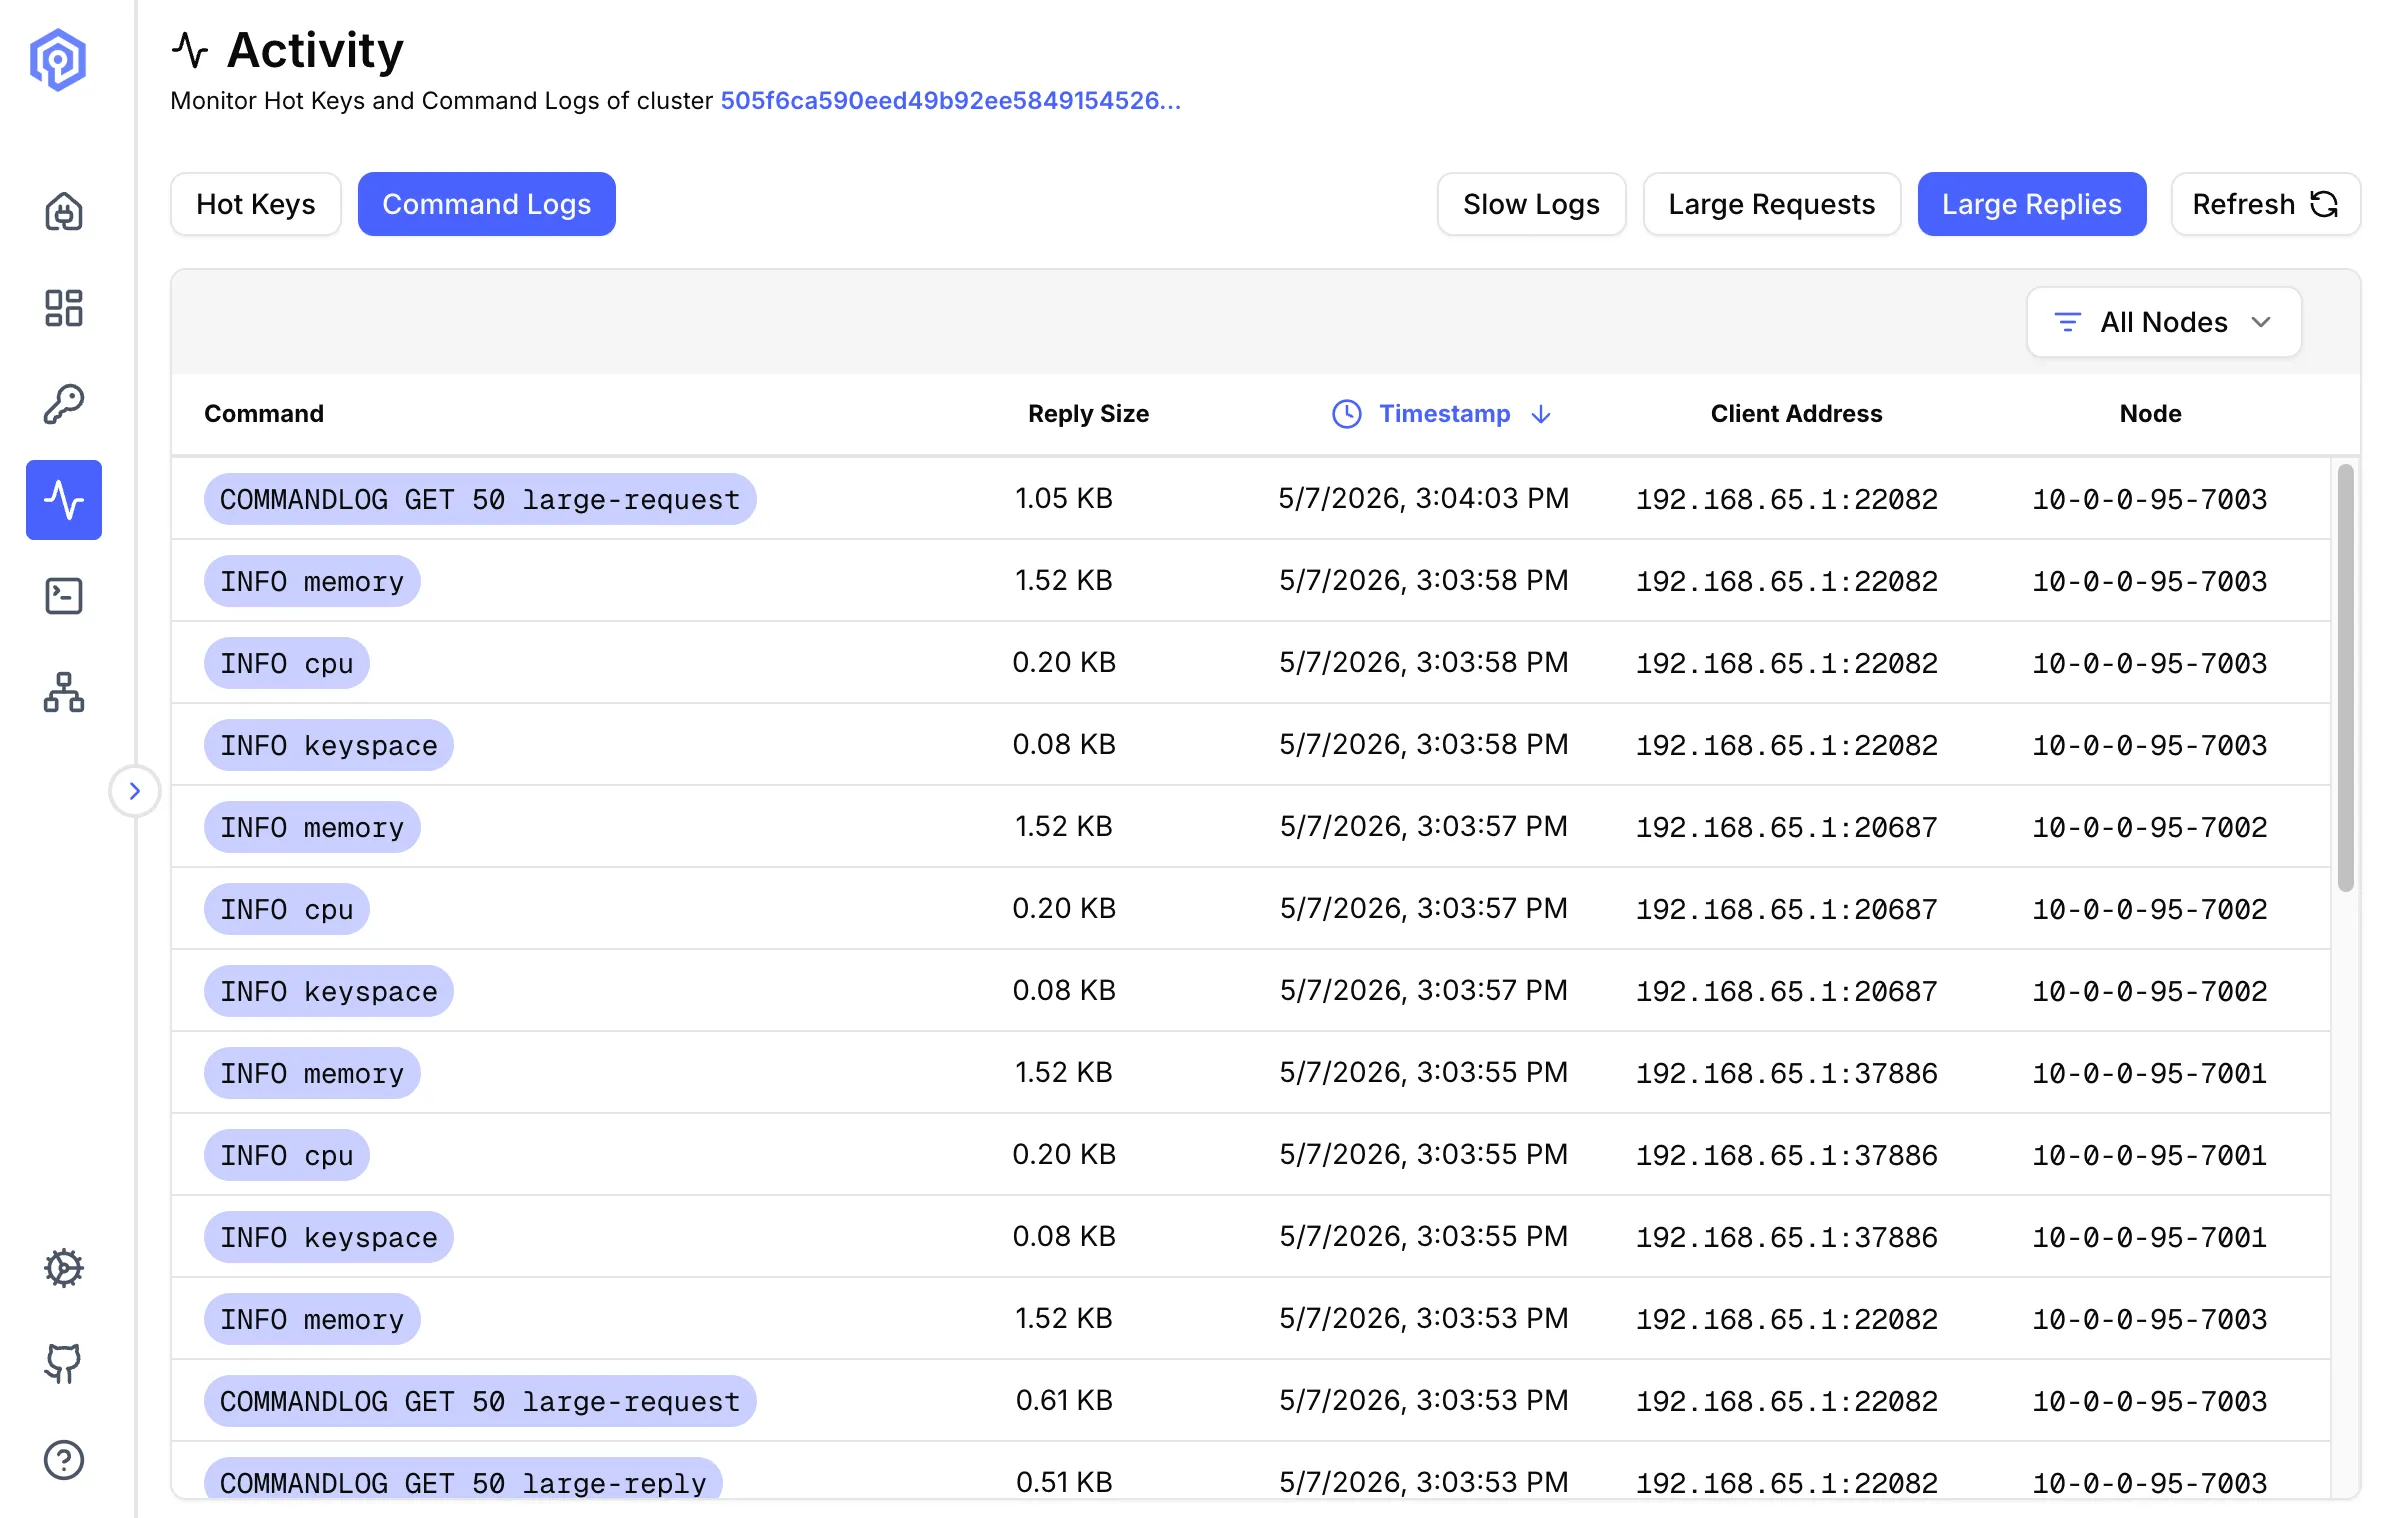
Section titled “Large Replies”Monitor commands returning large response payloads.
What are Large Replies?
Section titled “What are Large Replies?”Large replies are responses exceeding a size threshold, indicating:
- Oversized data structures
- Inefficient queries
- Potential network saturation
Common Causes
Section titled “Common Causes”HGETALLon huge hashesLRANGEretrieving entire listsSMEMBERSon large setsZRANGEwithout limits
Metrics
Section titled “Metrics”- Reply Size: Response payload size
- Command: Query that generated response
- Duration: Time to generate and send
- Node: Source node
- Client: Destination address
Setting Thresholds
Section titled “Setting Thresholds”Configure what constitutes a “large” request:
# Alert on requests larger than 1MBCONFIG SET commandlog-reply-larger-than 1000Next Steps
Section titled “Next Steps”- Optimize queries found in the Send Command
- Analyze key distribution in Key Browser
- Review cluster health on the Dashboard