Dashboard
The Valkey Admin dashboard provides a comprehensive overview of your cluster’s health, performance, and key metrics at a glance.
Overview
Section titled “Overview”The dashboard is your central hub for monitoring cluster node activity, displaying real-time metrics, node status, and performance indicators.
Key Metrics
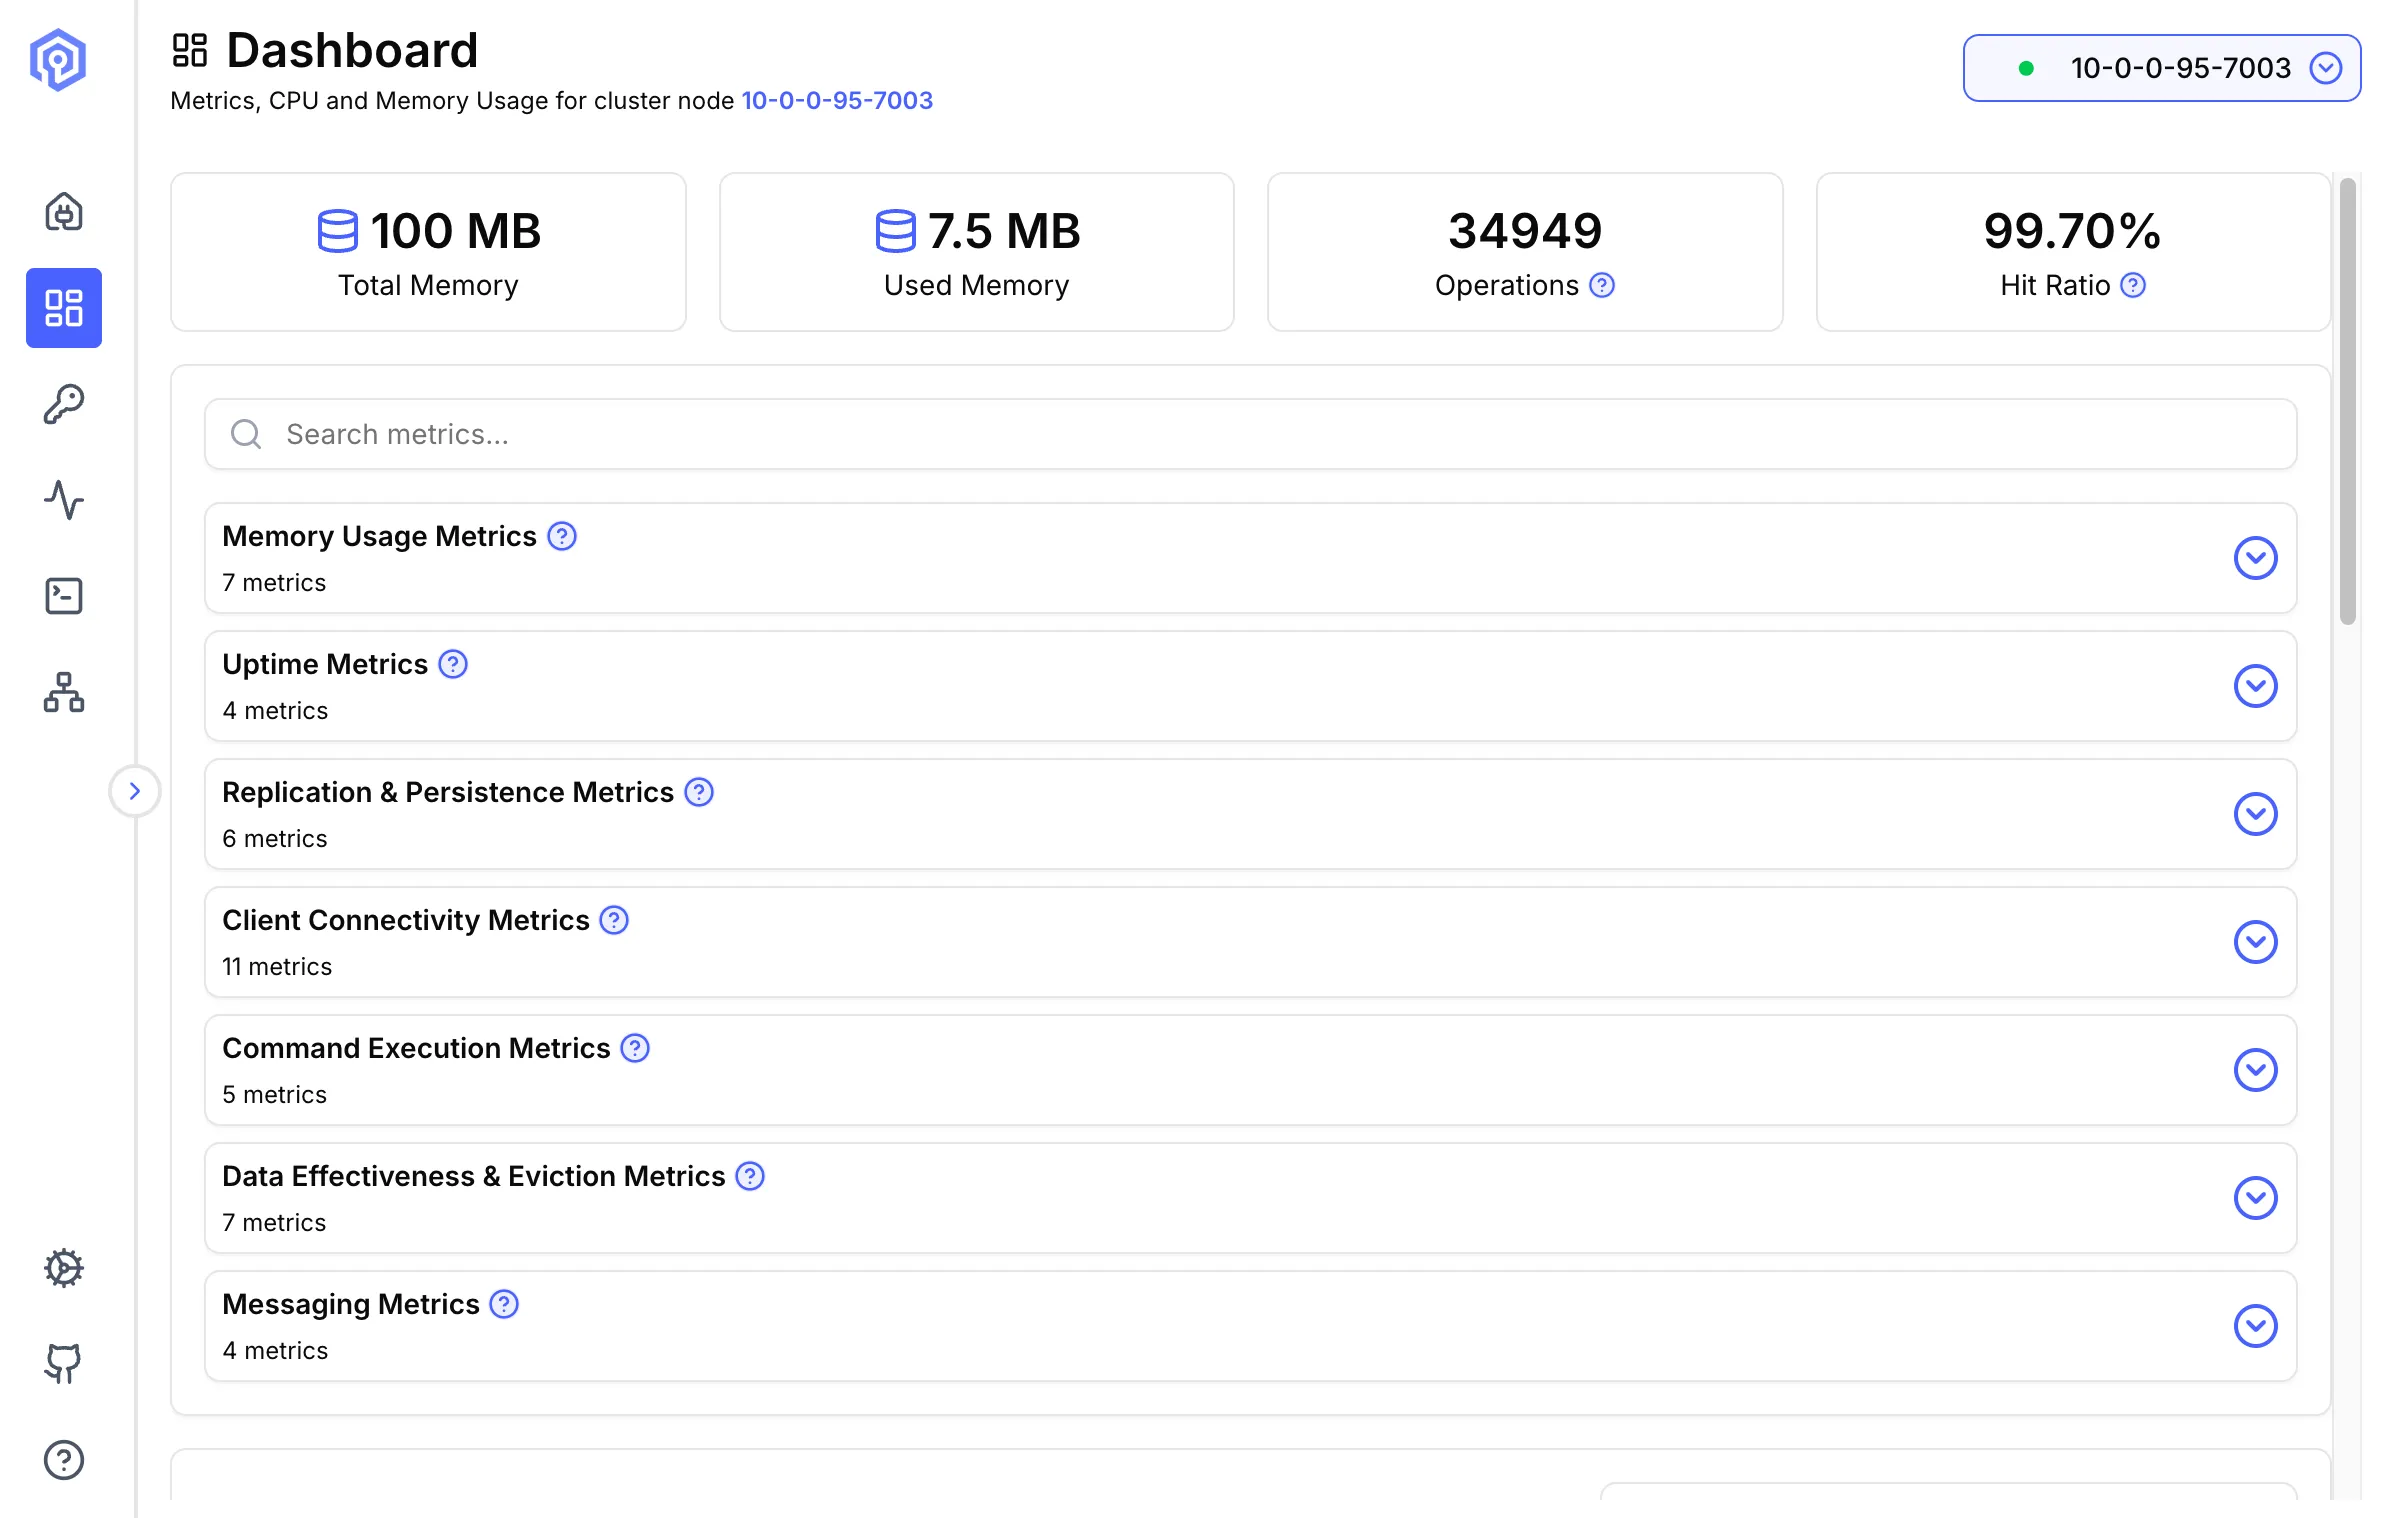
Section titled “Key Metrics”Cluster Health
Section titled “Cluster Health”- Cluster Node DropDown: View online/offline status of all cluster nodes
- Node Metrics: View INFO command metrics
- Key Type Distribution: Share of stored key types
- Memory Usage: Monitor memory consumption across nodes
- CPU Usage: Real-time CPU utilization metrics
Real-Time Usage Metrics
Section titled “Real-Time Usage Metrics”The dashboard shows CPU and memory usage metrics at configurable intervals:
- Default: 1 hour
- Configurable: Adjust to see usage over 6H and 12H
Metrics and Anomaly Detection
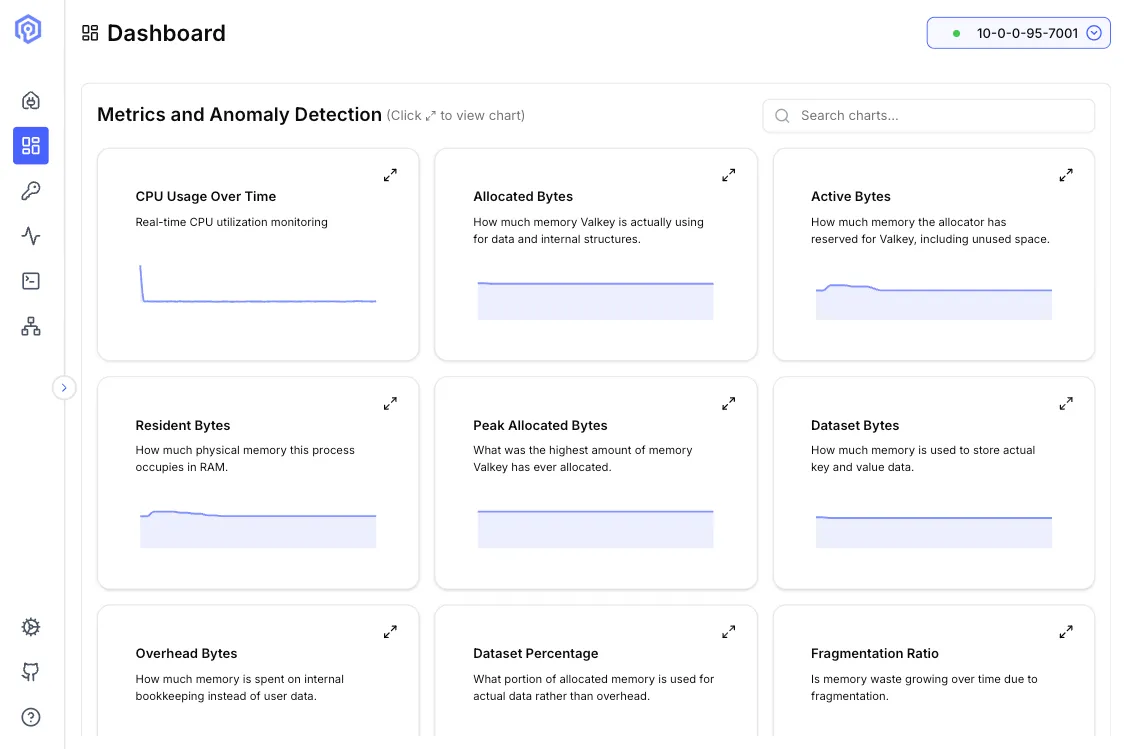
Section titled “Metrics and Anomaly Detection”The metrics view displays a grid of time-series charts, giving a detailed breakdown of CPU and memory behavior over the selected interval.
| Chart | Description |
|---|---|
| CPU Usage Over Time | Real-time CPU utilization monitoring |
| Allocated Bytes | How much physical memory is actively being used by data and internal structures |
| Active Bytes | How much memory has been accessed or touched by Valkey, including unused bytes |
| Resident Bytes | How much actual physical memory this process occupies in RAM |
| Peak Allocated Bytes | The maximum amount of memory jemalloc has ever allocated to Valkey |
| Dataset Bytes | How much memory is used to store actual Valkey data |
| Overhead Bytes | Memory spent on internal, non-data structures — Valkey’s own overhead |
| Dataset Percentage | Fraction of allocated memory being used for actual data |
| Fragmentation Ratio | A value growing over time may indicate memory fragmentation |
Anomaly detection highlights unusual patterns across these charts, making it easier to spot memory leaks, unexpected spikes, or fragmentation trends before they affect cluster performance.
Next Steps
Section titled “Next Steps”- Explore the Key Browser for managing your data
- Use the Send Command interface to execute operations
- View Cluster Topology for node relationships